
How to get tech and business wrong: six easy things to watch out for in media reports
How to get tech and business wrong: six easy things to watch out for in media reports
Hey, it's a better title than "six of the innumerable ways in which media reports about technology and business regularly get things wrong."

Since I have a bunch of post ideas that I don't have time to develop into full-size posts, I'll use this 'homage to Feynman' approach to get them out, mostly using graphics. TL;DR:
Charging different prices for the same thing to different people may be better for [most of] those involved.
When an economy expands, the rich tend to become disproportionally richer (though the ‘rich’ may not be the same people as before), but everyone is better off.
Large companies tend to be more dysfunctional than small companies, but does being large make you dysfunctional or are large companies more able to survive despite dysfunction than small companies?
For better research and development, increase the weirdness factor.
Despite the caterwauling of some people yearning for the good old days of fast growth, slow growth isn’t necessarily a sign that development has stalled
Sensationalistic media promotes early research results with much bombast, ignoring the long slog from a lab rig to a product that can be deployed at scale.
Thing 1: Price segmentation (“discrimination”) is good
Price segmentation is charging different prices to different people for essentially the same product (or products that are different only to separate the segments, not for technical reasons or in response to different customer desires).
Let’s consider a market with two segments: a high-value segment (the rich, willing to pay more for the product) and a low-value segment (the poor, who can’t afford to). Let’s say this product allows the seller to separate segments at no cost and just for the heck of it the product has no variable cost, so we’ll just care about revenue.
Busybodies get very upset at the idea of companies using price segmentation (for which they always use the scary economics term “discrimination”) to charge different prices to different segments.
It does sound unfair, doesn’t it?
Let’s see what happens in both cases: when companies can charge different prices and when the busybodies manage to force a single price on the market.
The bottom panel on the left shows the demand curves for the two segments and the market;1 the top panel shows the revenue at each price level (price times units), with the optimal points marked.

By comparing the two cases, one conclusion is inescapable: forcing a single price for both segments has the low-value segment subsidizing the high-value segment.
Since in many cases the people advocating for a single-price policy do so for “social equity,” this is a counterproductive action, to say the least.
Thing 2: The rich getting richer is usually a sign of things getting better (in a free market)
Yanis Varoufakis and a number of left-leaning commentators on technology are predicting the end of capitalism and its replacement by “techno-feudalism” (which more correctly should be techno-oligarchy).
In their view of the world, the super-rich will become even richer (probably right); while everyone else —including the knowledge workers in the upper-middle class who putatively create the content on which the super-rich’s wealth is supposedly based— will become poor (almost surely wrong, even if we interpret that to be the relative “poorer than now” instead of the absolute state “poor”).
Let’s see what happens when an economy expands, that is when everyone gets richer.
We need a short detour here, because the distribution of wealth is extreme-dominated and that changes how we can analyze it.
Extreme-dominated means that when we get a sample that has an average far from that of the population, that’s probably caused by a single observation in the sample, not the entire sample:
If we have a room with ten people with an average height of 1.95 m, that’s likely to be ten people with heights between 1.90 m and 2.00 m, not nine 1.75 m persons and a 3.75 m giant; that’s because the distribution of height is not extreme-dominated.
But if we have ten people who attended Harvard in a room and the average wealth is a bit over $10 billion, that’s more likely to be Bill Gates and nine middle-class Harvard graduates than ten 10-billion-each billionaires: the distribution of wealth is extreme-dominated.2
To analyze extreme-dominated distributions we must look at the distribution itself, not moments like average and variance; typically we’d characterize some N-iles: percentiles, quintiles. Here we’ll look at the cutoff points for the rich (top-1%) and the very rich (top 0.1%). (End of detour.)
So we’ll ditch our friendly well-behaved distributions like the Exponential and Normal (and even the fat-tailed Logistic and Gumbel, which are still not extreme-dominated) and go with a scale-invariant Pareto distribution, which is extreme-dominated.3 What happens when the economy expands?

First, everyone gets richer! But, while the average increases by 33% (averages aren’t very informative in skewed distributions, especially in extreme-dominated ones), the median wealth only increases by 12%. The cutoff point for the top-1% more than doubles (increases 124%) and the cutoff point for the top-0.1% more than triples (increases 218%).
Note that over time the people in these groups change, as do the sources of their wealth. We’re just using a reduced form for the entire population.
The observations, that the rich (the top 1%) are getting richer and that the very rich (top-0.1%) are getting even richer than the rich, are therefore compatible with an expansion of the economy in general, no need for techno-oligarchies.4
Thing 3: Why do dysfunction and large companies go together?
Browsing the intertubes we find AI researcher and author of a book about AI Pedro Domingos tweeting (exxing?) the following:

Granting the premise (that big companies are dysfunctional), for the sake of argument, what is the causality?
Does a company getting big make it dysfunctional; does being big allow a company to survive dysfunction which kills smaller companies; or is it something else entirely, possibly including elements of both?
It’s easy enough to see how growing a company can lead to dysfunction, simply by considering order effects in recruiting: assuming a company has a pool of workers to choose from, and that recruiters are competent at their job, small teams will have —on average— better people (if you pick the 3 best first, when the team grows from 3 to 6 the next 3 aren’t as good as the first 3, and so on).
This order effect can be illustrated easily using the average of the “top N picks” of Normally distributed workers:

Note that in a more realistic model the average would be replaced by some production function to take into account the interactions between people. As most of us know, a single bad colleague can be enough to destroy the work of a large team, so these recruitment order effects can be much more abrupt than that smooth Normal-derived curve above.
The opposite causality is: the existence of dysfunction in the workplace is the reason we see survival of large companies only. (That is, that dysfunction “causes” big companies by killing small ones.)
Basically, in this case there are many small companies that suffer from the same dysfunctions as the large companies, but they aren’t strong enough to survive their own dysfunction, so they die. Therefore we see only small companies where the dysfunction hasn’t killed them yet or large companies with enough size to survive the dysfunction, possibly have grown from small companies before they were killed.
The truth is probably a combination of both, moderated by the effect of good management.
Thing 4: Vive la différence!
When we have a chance to pick-and-choose the best, for example in basic research, we should emphasize variation.
(This is a short variation of something covered in a section in Pitfall 9 of my book; get a free sample here, but note that sample doesn’t include Pitfall 9.)
Let’s say we can fund a large number of researchers on telomere extension or superconductivity or zero-point energy. Because what we care about is the best possible solution, we should try to encourage diversity of approaches and thought.
This can be seen easily by plotting the distribution of the maximum of many draws from a Normal distribution as a function of the standard deviation: the more variation there is in the distribution of the individuals, the higher the average of the maximum (and its variance).

In non-probability terms, the more we incentivize different approaches, the more likely we get a high-value solution. Not just more approaches: more and different.
This might have some implications for the funding of research by institutions where the proposals are evaluated by “peer review” (i.e. conformance) and that’s before we even consider the problems of adverse selection in such institutions.
Advantage for angel investors and venture capitalists, I guess.
Thing 5: Periods of slow growth are common within technological evolution
There’s a lot of complaining on the intertubes about how all the important results in science are in the past and how scientific innovation has slowed down (having a robot helicopter flying around on Mars notwithstanding).
The funny thing is that this is a common and somewhat periodic lament, usually of people who are out-of-the-loop on what’s actually happening in science.
So here’s a simple illustration of why they’re wrong: because there are waves of large innovations that take time to diffuse, while at the same time there are incremental increases in innovation that follow the usual s-shaped life cycle.
In this illustration there are four waves of innovation, all adding to some measure of value, and their timing creates “lulls” or “slowdowns” in the aggregate observables, but anyone who follows the actual development of the different technologies (that’s the blue lines) can see the next wave in development (in what would be called the introduction phase for a product life cycle; just like with product life cycles, only the keen observers outside the actual development process will see what’s coming).

Our linear-scale brains have difficulty with processes where growth is —temporarily and within limits— essentially proportional to size, i.e. exponential; in many cases, the earlier parts of development do follow such a growth process, which is hidden by the apparent flatness. Plotting those s-shaped curves on log scales shows how the “nothing much is happening in this sector” appearance can be deceiving:

Yet another reason why knowing what is happening in detail instead of looking at aggregates (in other words, being an insider who’s involved in the work versus an outsider reporting on what’s visible from the outside) is usually the difference between a positive and negative outlook on technological and scientific progress.
For all the damage mixing science with politics can create, the march of progress hasn’t been stopped.
Did we mention we have a robot helicopter flying around on Mars? Would anyone like a photo of a supermassive black hole, taken with a planetary-scale synthetic aperture radio-telescope?
Thing 6: It’s a long way from a lab rig to an economy of superconductors
“Great new discovery XYZ will change the world forever.” “NewCorp invests gazillions on new tech XYZ, expected to be the next Apple.” “NewCorp is the guaranteed growth stock for the long term we’ve been waiting for, says Jim Cramer.” “Impending NewCorp factory closing puts pressure on struggling community.” “Brave politicians offer plan for saving NewCorp.” “CEO of NewCorp arrested today on fraud charges.” “Great new discovery WVT will change the world forever.”
This script isn’t new, but it has metastasized into a social-media and engagement-driven juggernaut, where seemingly every research group’s communication of an incremental lab result is hyped to the maximum, every instant expert on social media has a strong opinion about something they barely learned the name of, and every quick-buck artist has some ready-to-offer investment opportunity “in the field.”
In reality:

Assuming that something worked as a lab rig and isn’t a case of scientific fraud, there’s a lot of steps to get from it to a product at scale.
First, note “worked” is different from “works.” When something worked once or a few times, it’s a lab rig (something built specifically to test an idea) that worked; a paper can be written, a grant can be renewed, a PhD student can ascend to post-doc rank. When it works on demand, under the supervision of the experts, it’s now a demonstration, a proof-of-concept, something that can be used to get financing.
There’s a lot of work to get something that works consistently under lab conditions, the tech demo, say 0.75 grams of a superconductor in a test tube, to something that can be tested by potential customers and integrated with other elements. This second something is a prototype, which for example would be a one-meter wire of superconductor for people to ascertain its usability in electrical transmission and maglev potential.
A prototype is still not a product, but serves as a platform to understand what needs to be done to turn the technology (the superconductor) into a product (something that can be used outside the lab by people who didn’t dedicate their lives to it).
Assuming that a prototype is feasible, then all that’s required is: product engineering, production engineering, user interface and user experience analysis, supply chain development, securing financing, obtaining parts and materials, legal and regulatory compliance, training personnel, building facilities, tooling, and the list goes on. That’s before production can start. An illustration of an instance of the process:

(The success of software companies deceives many people into thinking that all technology can be like software; but software has unique processes and economics of development and deployment, and is a bad model for other technologies.)
Assuming all the steps needed to get a prototype (usable in the lab under expert supervision) to a product (usable in the world by normal people) are done, there’s still no guarantee that the product will succeed and gain scale.
But taking a moment to consider this would stop TwitterInstantExpert from getting the top position on the algorithm-filtered landing page by being first.
Eagle-eyed readers will notice that unlike economists, we plot the demand as units sold (quantity) as a function of unit price, like one should; for increasing realism we also use non-linear demand functions. Why non-linear: a linear function predicts equal change in units sold when price goes from 100 to 101 as when price goes from 1 to 2.
This example plus a further analysis of extreme-dominated distribution versus fat-tail distributions, which are not the same, is in the technical notes of my book (free sample here; the technical notes aren’t in the free sample). Taleb gets the two confused all the time, which is bad for people who take him seriously. Fortunately, few influential people do.
We can show the same effects with the other four distributions, but the point is that those distributions are inappropriate for wealth, so using them offers those who are pushing this “techno-feudalism” nonsense a way to attack this regularity of economics. (In general, with free markets, economic growth leads to decreasing poverty but increasing inequality; forced reallocation of wealth has historically led to increases in both inequality and poverty.)
Interestingly, using FRED we can see that while the relative wealth of the rich (measured by the average top-1%er’s wealth divided by the average bottom-99%er’s wealth) has been on an increasing trend, from 30 times as much in 1990 to almost 50 times as much now,

the relative wealth of the top-0.1% inside the top-1% has been more or less stable between 5- and 6-fold:

The top-0.1%ers are getting increasingly richer compared to all the others (the bottom 99.9%, or “the poors,” as they call them; chart below), but not very noticeably with respect to the rest of the top-1%ers (chart above).
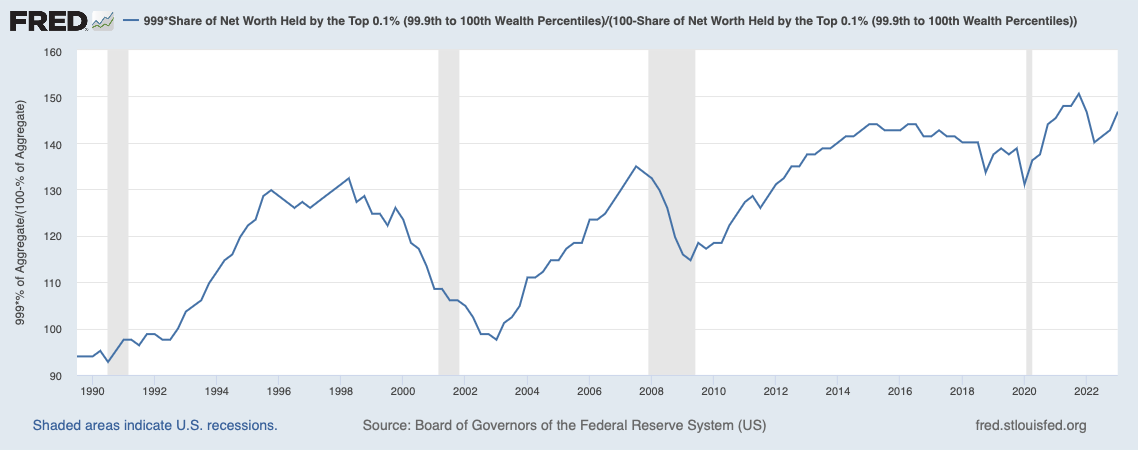
Paraphrasing Mel Brooks, it’s good to be in the top-0.1%: from being 95 times as wealthy as the average of the rest in 1990 to being almost 150 times as wealthy now. Still, basically just keeping station inside the top-1%, which is not a sign of any techno-oligarchy rising.
N.B.: These are averages, not cutoff points, and they are computed from FRED aggregates, hence the need for the correction factors ex: as there are 99 times more households in the bottom-99% than in the top-1%. Also, as mentioned above, averages are less than ideal in scale-independent distributions, but the narrow band of the second FRED graph compared to the trend in the first FRED graph suggests that we aren’t seeing the rise of a class of oligarchs ruling over “those whose knowledge work creates their wealth.”
I remember arguing #6 with nanotech enthusiasts. Some of them were convinced that when a nanoassembler capable of reproducing itself was created, all other manufacturing would be obsolete the next day.